 VerityIQ
The marketing mix model you can actually trust.
Built on your Shopify revenue, not platform claims. Every Monday: the honest range each channel could have driven, what your funnel and your customers actually did, and the one change worth making.
No single magic number. Anyone who gives you one is guessing.
A live report from Northline Supply, our demonstration brand. Every figure shown is simulated.
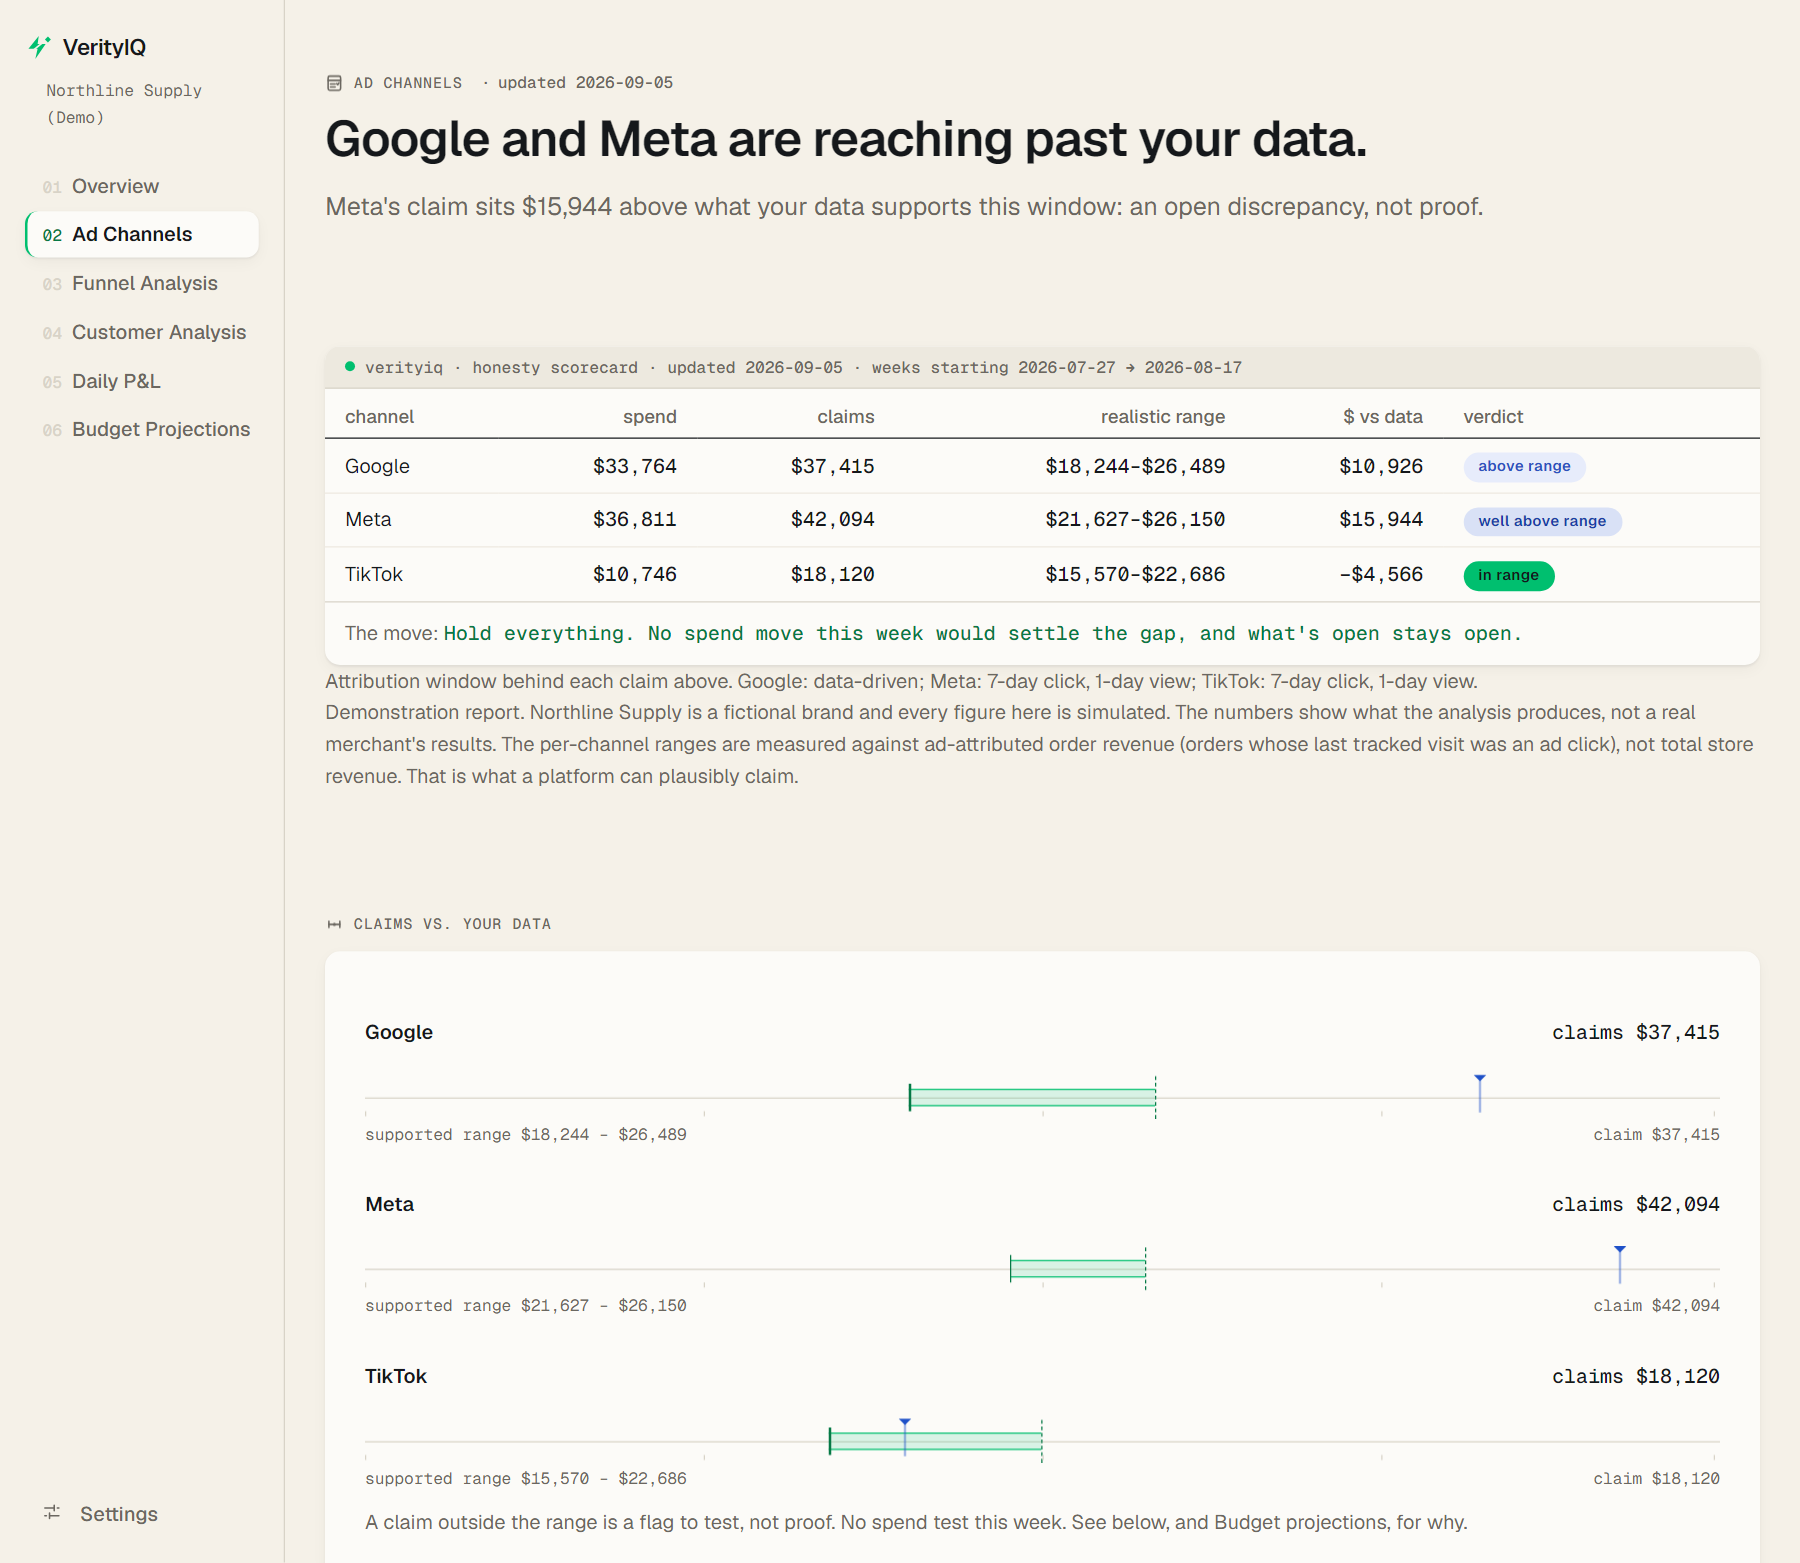
Every claim, next to the range your data supports.
One row per channel, one verdict per row, stated as a position rather than an accusation. Here is a real week from our demonstration report.
A claim above the range is a gap to test, not proof. It is the platform's number sitting above what your data can support, not a verdict on the channel.
| channel | spend | claims | realistic range | $ vs data | verdict |
|---|---|---|---|---|---|
| $33,764 | $37,415 | $18,244–$26,489 | $10,926 | above range | |
| Meta | $36,811 | $42,094 | $21,627–$26,150 | $15,944 | well above range |
| TikTok | $10,746 | $18,120 | $15,570–$22,686 | −$4,566 | in range |
Northline Supply is a fictional brand and every figure here is simulated, the numbers show what the analysis produces, not a real merchant's results. Ranges are measured against ad-attributed order revenue, not total store revenue, because that is what a platform can plausibly claim.
Spend is a signal. Revenue is the truth.
Tracking broke; the reporting never changed. Anyone who hands you one number for what a channel “drove” is guessing, confidently. We show the realistic range instead, and where each platform's claim falls outside it.
One report. Six views. Refreshed every Monday.
A private weekly report at your own link, not a dashboard. It reads your ad spend against the only revenue that hit your bank, and holds every claim to a range your data can support.
Overview
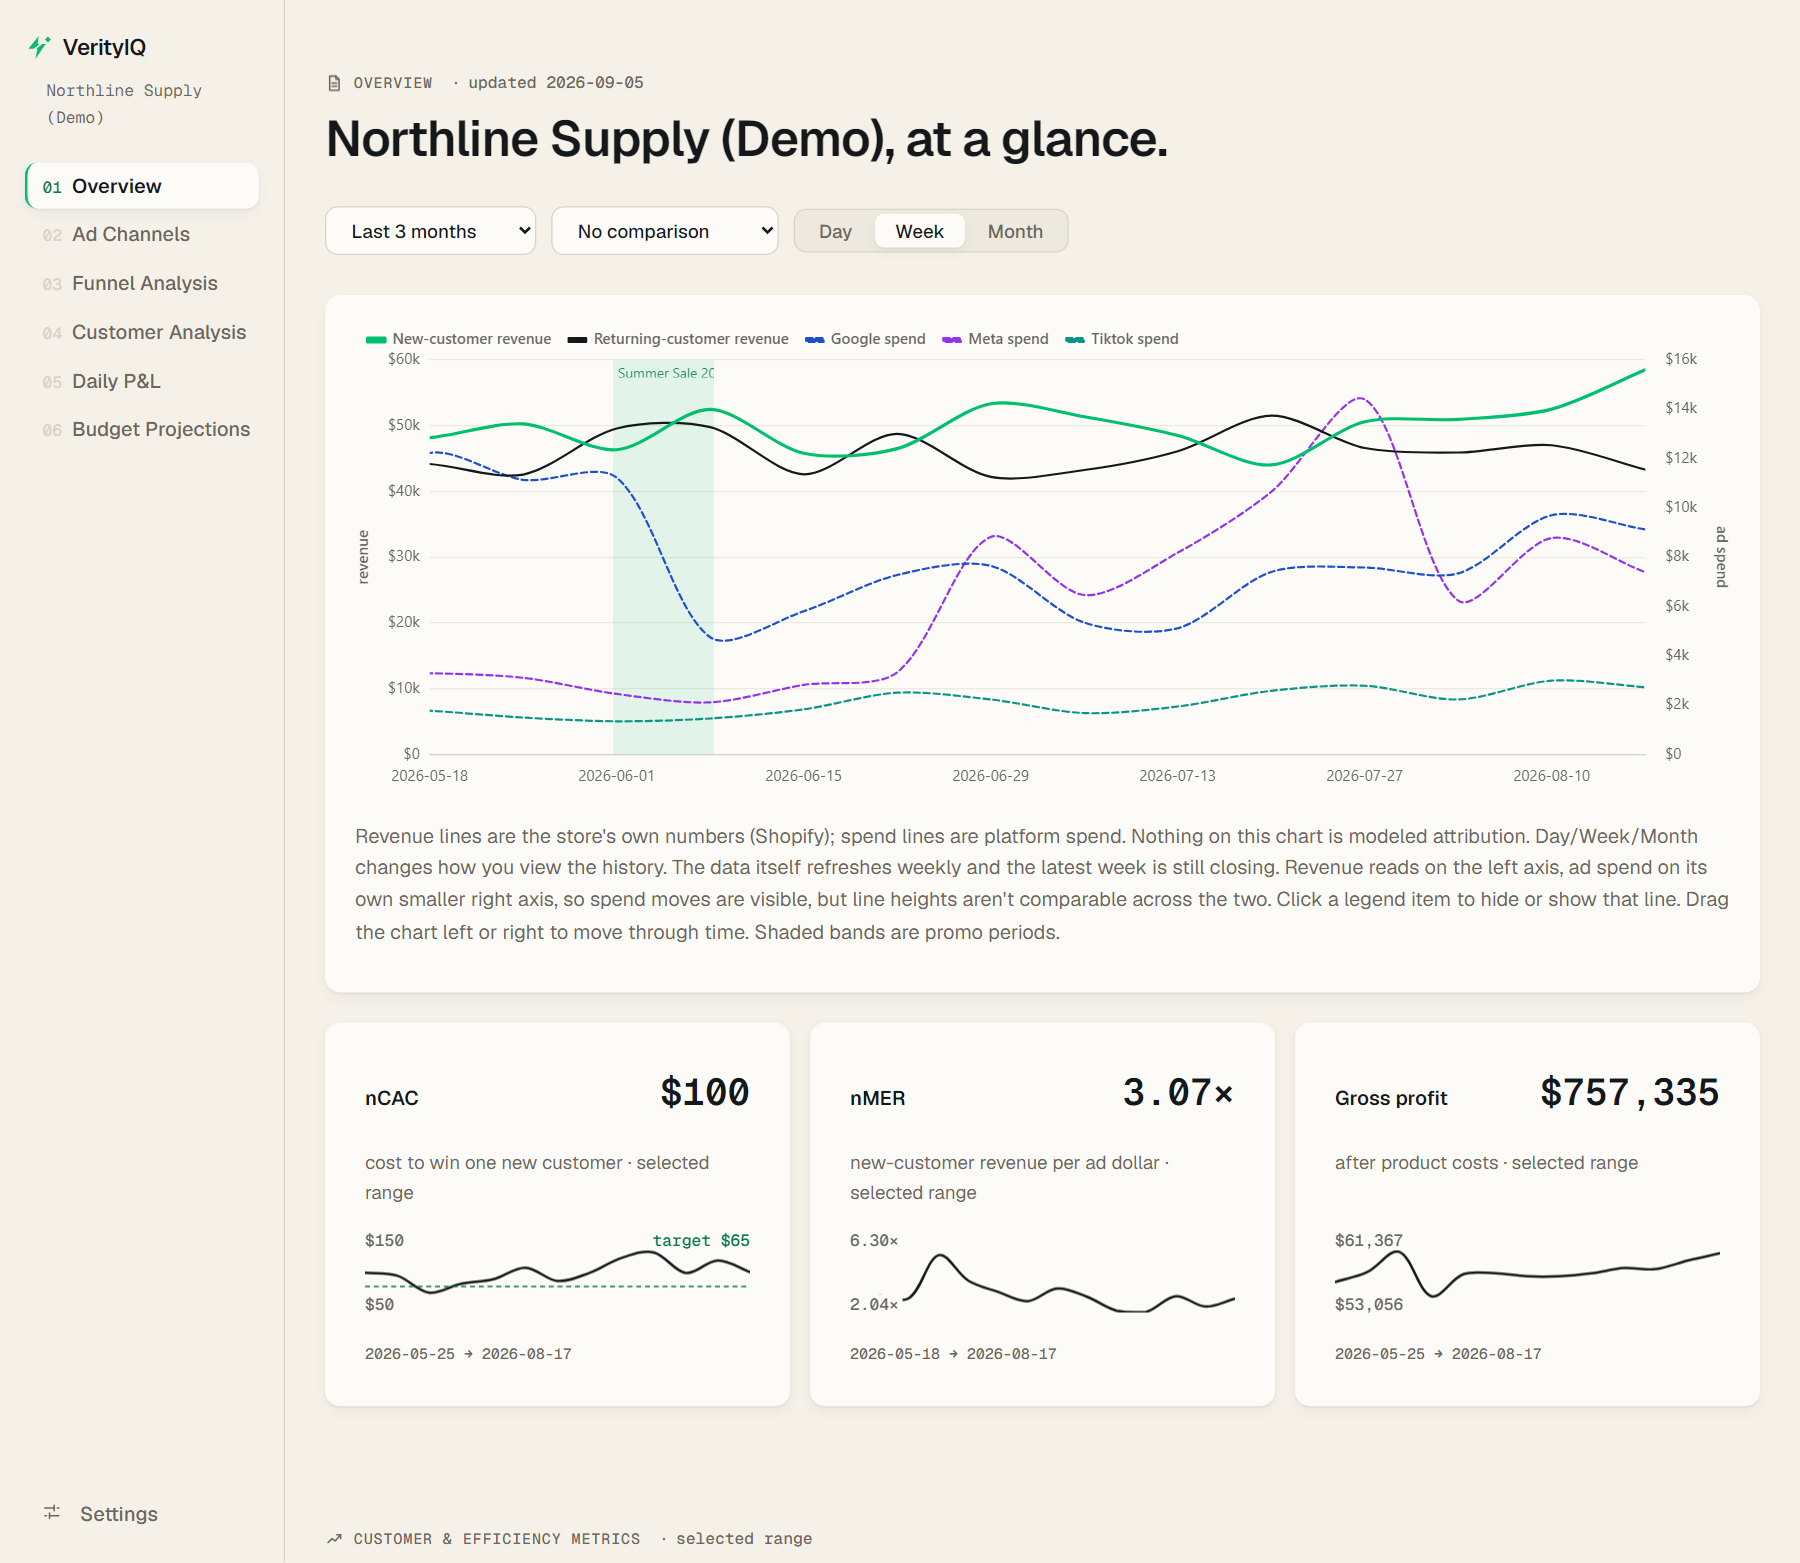
Revenue and ad spend on one chart, your promos marked. nCAC, nMER and gross profit against target, and whether you're on pace for the year.
Ad Channels
The honesty scorecard: every platform's claim next to the range your own data supports, the gap in dollars, and one recommended test.
Funnel Analysis
Where your spend lands across the funnel and how the mix has shifted. Stage totals only, campaigns we can't classify stay unclassified.
Customer Analysis
What a first order is actually worth, who comes back, and how each acquisition cohort has really grown. Measured, never projected.
Daily P&L
Contribution after ad spend, day by day, against your margin floor, plus a max-CAC calculator you can move.
Budget Projections
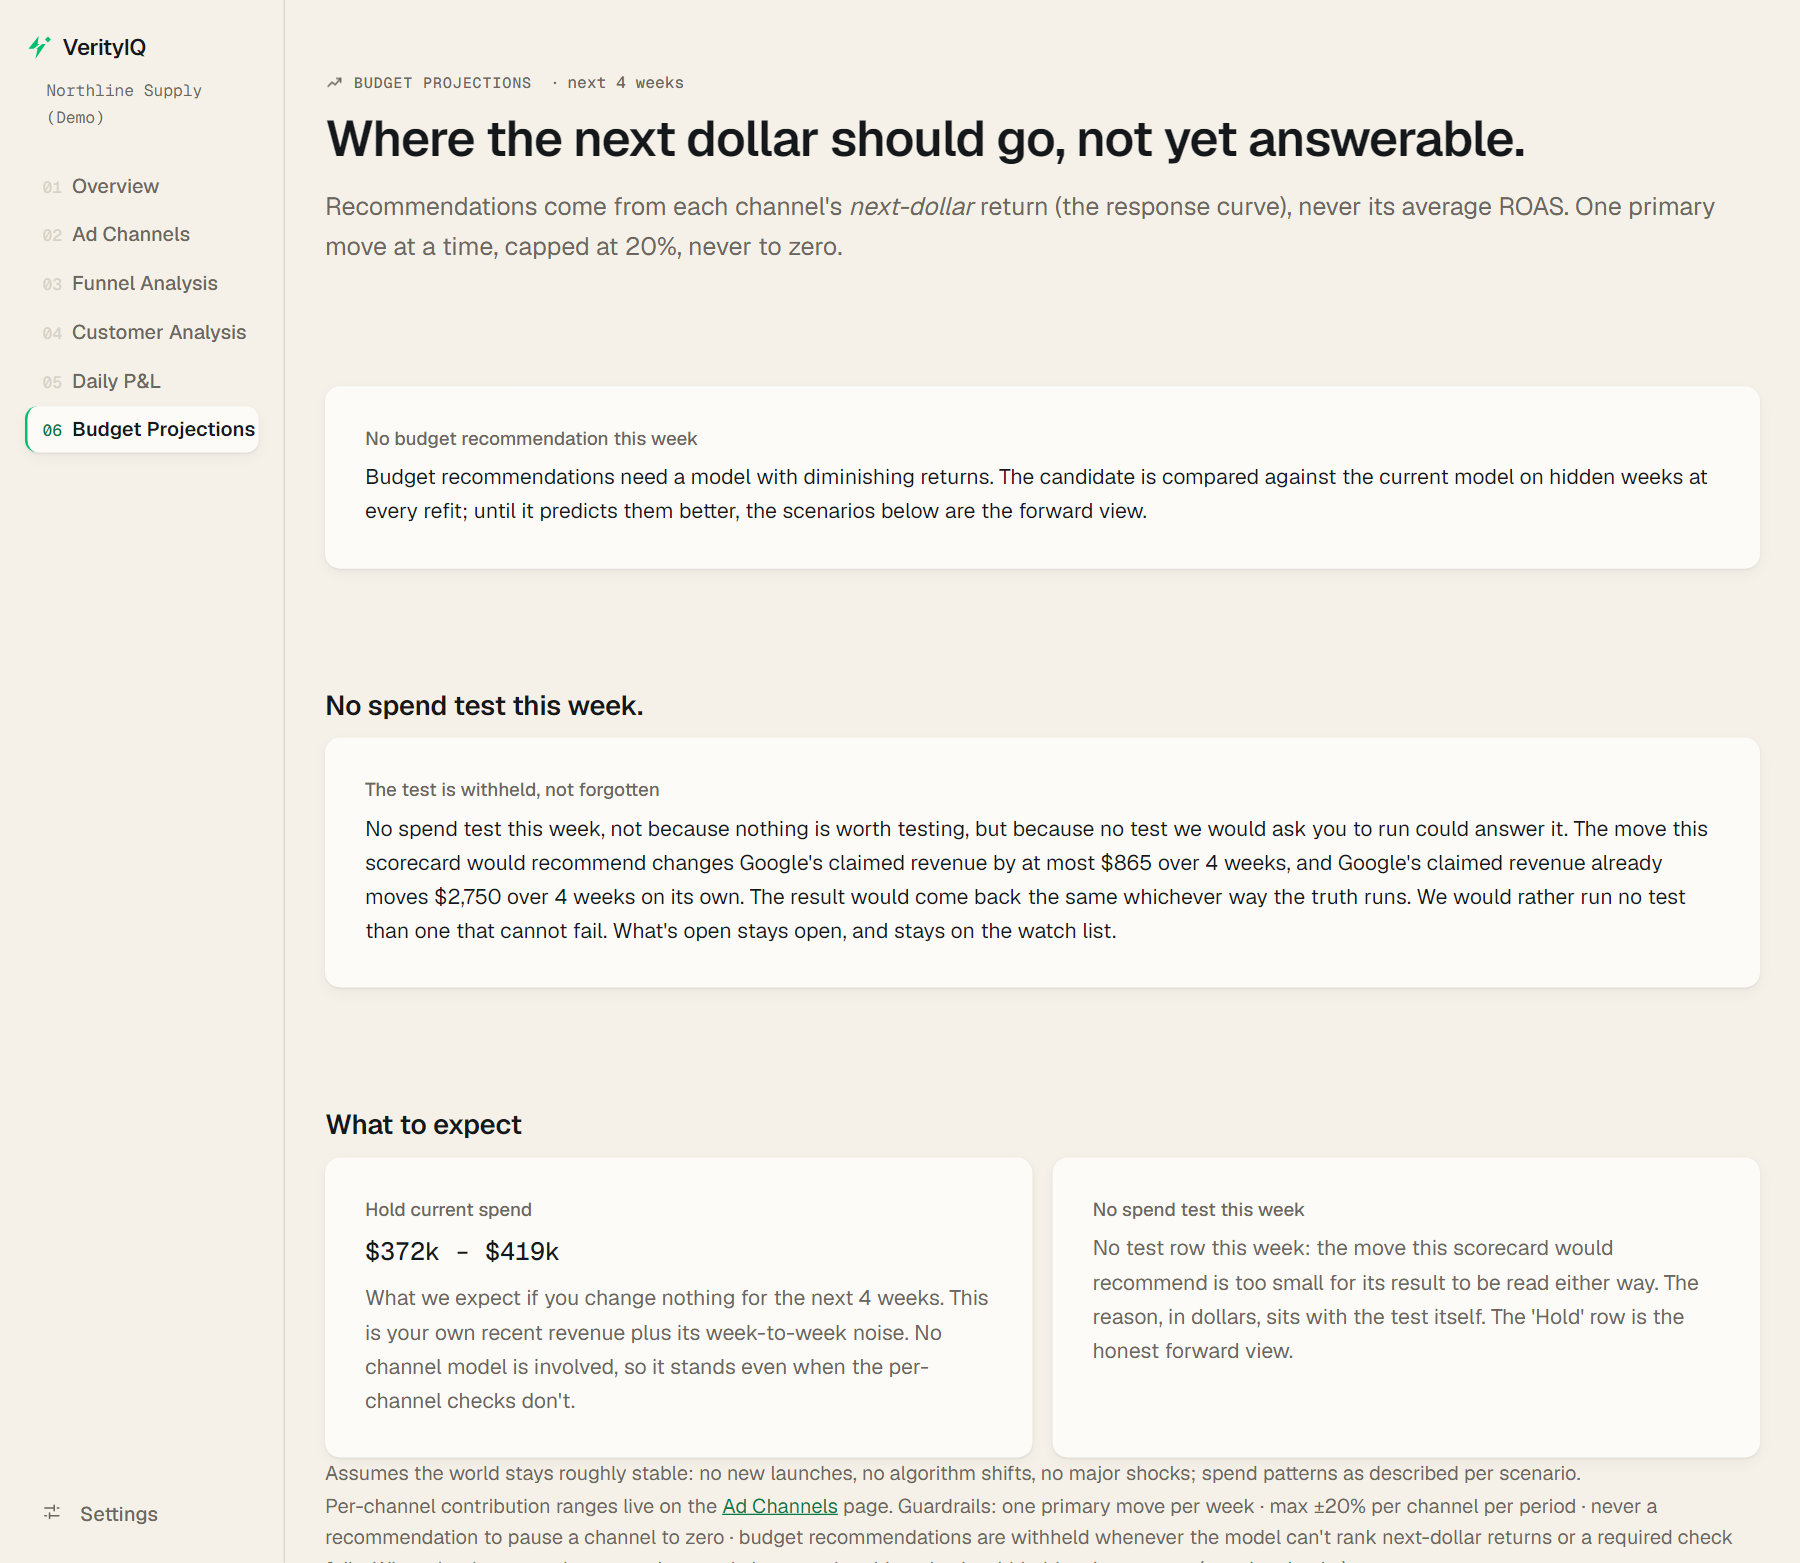
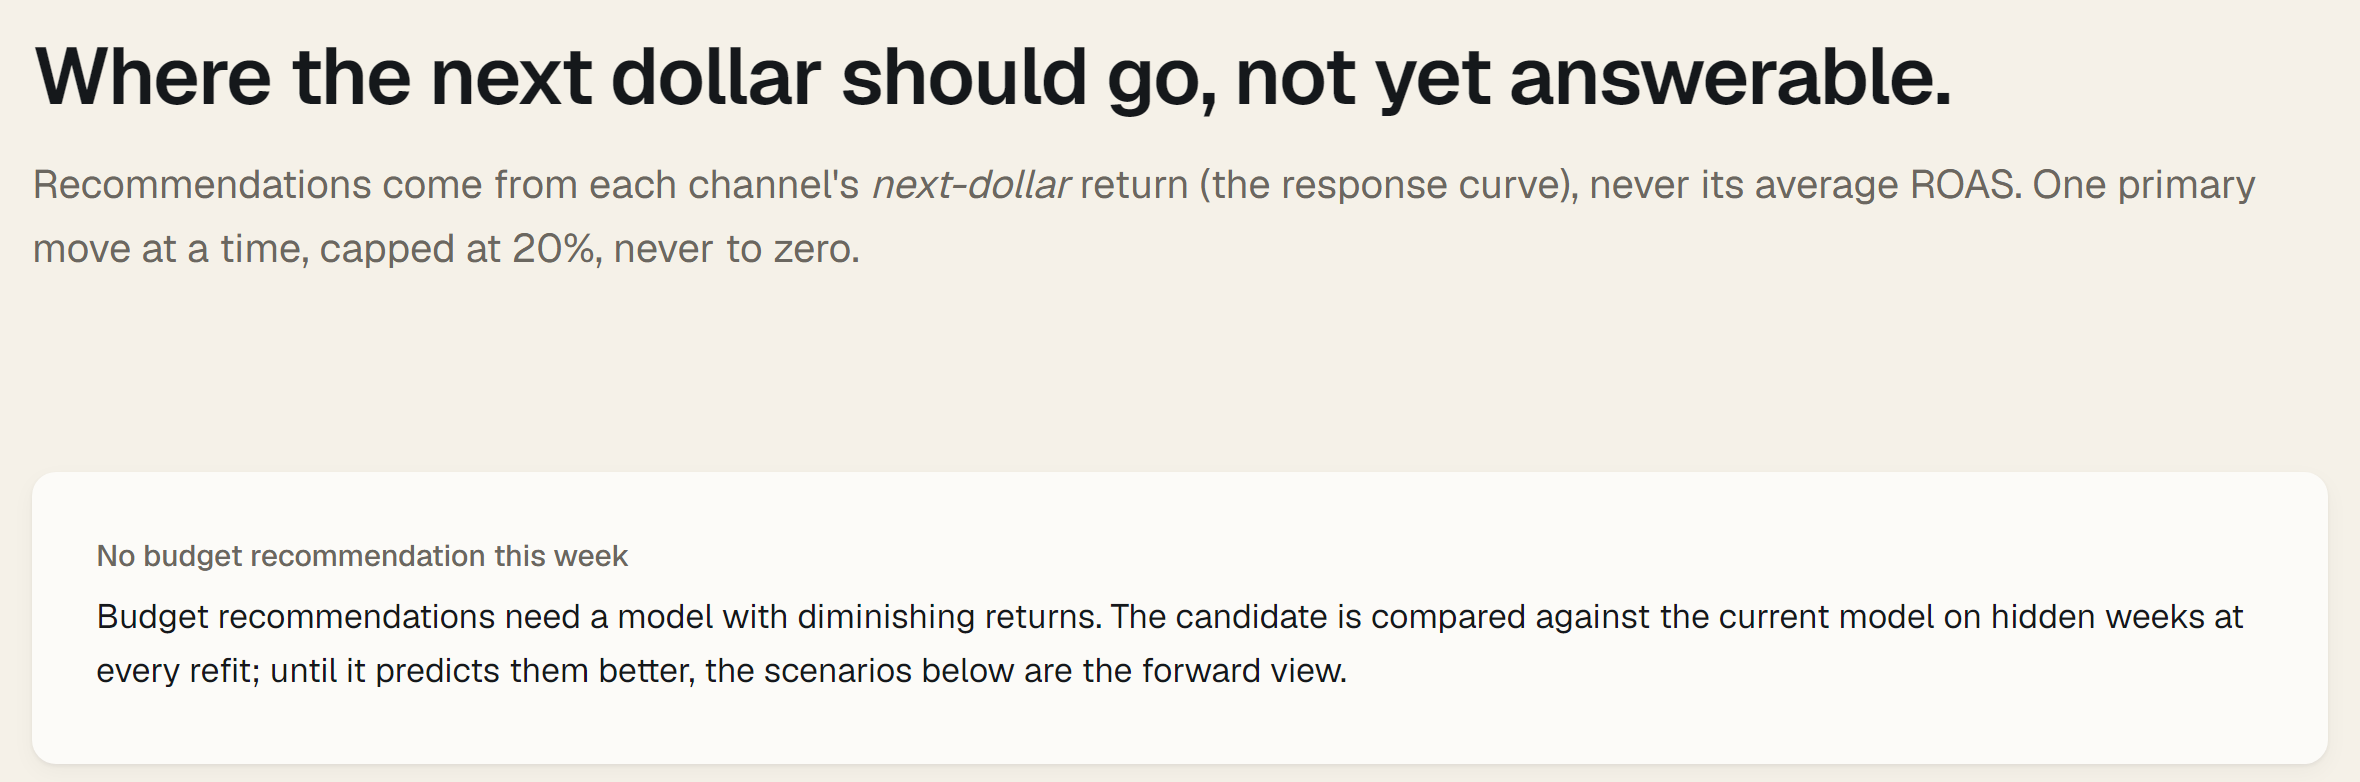
Where the next dollar should go, from each channel's next-dollar return. One move at a time, capped, never to zero.
Plus Settings, and a Checks page where you can audit the model's own working.
Connect what you already have. Read it on Monday.
We do the part you can't do in a spreadsheet: work out what your revenue actually did when your spend moved, and keep the uncertainty visible instead of averaging it away.
- 1Connect Shopify, Google & Metaread-only, no pixel, no tags
- 2We rebuild the model weeklya supported range per channel, uncertainty kept
- 3You read it, every Mondaythe gap in your own dollars, and one move
Direct connections today: Shopify, Google Ads, Meta and Klaviyo, all read-only. Any other channel comes in as a spend and claim export, and is scored the same way.
- Meta claims
- $42,094
- Supported range
- $21,627 – $26,150
- Verdict
- well above range
- Spend test
- withheld this week
Why there is no move. No test we would ask you to run could answer it, and we would rather run no test than one that cannot fail. What the scorecard flagged stays open, and stays on the watch list.
The test on the table. It raises TikTok's spend and watches Google's claimed revenue. That move changes Google's claimed revenue by at most $865 over four weeks, and that number already moves $2,750 over four weeks on its own, more than three times what the test would create. The result comes back the same whichever way the truth runs, so it would tell you nothing.
Meta's gap: untested, not cleared. This arithmetic doesn't reach it, and Meta's gap is the larger one: a move has to clear $5,332 over four weeks to show there, and pushing every other channel to the most we would recommend gets to about $2,333, the best case, since it assumes Meta claimed all the revenue those pushes create. That is a limit of the size of move we will recommend, not of your data, a bigger move would read. It would have to be a large one: at least 2.75× the biggest move we would ever put to you, on both other channels at once.
What we deliberately don't do.
Most of these would be easy to build and would make a better demo. They would also make the number worse, and the number is the product.
- No “Meta drove $X” to the dollar. Contribution appears as a range with an explicit share for everything else, or not at all.
- No daily refresh. The weekly cadence is the intervention.
- No ad-set or ad-level views. Below the channel, the data can't carry the weight.
- We advise, you decide. We never move your budget.
- Under about six months of history, we say so rather than hand you a number you shouldn't lean on.
Who it's for.
Shopify brands running $30k–$500k a month across two or more channels, whose finance model and ad dashboards keep disagreeing.
The model needs clean data and calibration to your business, so every brand gets hands-on setup and validation before the report goes live. That's why we take a few at a time. The wait is the quality gate.
Where's my single number?
There isn't one, and anyone who gives you one is guessing. Slicing revenue per channel to the dollar is the hardest problem in marketing, and platforms do it daily anyway. We show the realistic range each channel could have driven, and where each claim falls outside it.
What data do you need?
Read-only access to accounts you already have: your Shopify store, Google Ads, Meta and Klaviyo. No pixel, no tags, no new tracking. Any other channel comes in as a spend and claim export.
How long until it's useful?
Honestly: a while. The model needs around six months of history before the ranges are tight enough to act on. Under that we say so, rather than show you something confident and wrong.
Is it a dashboard?
It's a report, not a dashboard. Six views at your own private link, refreshed every Monday, read-only. The newest week is marked “still closing” until it completes. You read it once a week and get on with your day.
How is this different from a full marketing mix model?
Same category, different bargain. The enterprise tools cost $50k–$200k a year and expect a data team to run them. We work from the Shopify data you already have, and we publish the uncertainty instead of resolving it into one confident figure.